
BACKGROUND
Every Tuesdays, my friends and I enjoy playing role playing games (RPGs), especially table top RPGs such as Dungeons & Dragons (D&D). Every week, we get together and pull out our laptops, character sheets, and review our previous notes to return to the fictional fantasy worlds we created (or were created for us) and do battle, solve mysteries, and tell stories over some ciders (and Le Croix). This ritual is important because it allows us to disconnect from the real world and allow our imaginations to run wild. After every session, we think about the various actions that took place and review how things would have been different if the roll of a dice went a different way.
I first started playing D&D Second Edition when I was a kid after I was exposed to it at a comic book store (Golden Apple Comics in Los Angeles). I still remember the strange colorful dice rolling on a table top mat and people scratching away at paper using stats that I wasn’t familiar with. In high school, my friends and I would play different campaigns from the D&D and Forgotten Realms worlds, creating characters based on rule books using statistics and probabilities. The key ingredient with any adventure is having your fate determined by a single dice roll. The iconic dice in RPG is the d20 or the 20-sided dice. A d20 dice is usually used to determine whether you “hit” your opponent, use your skills to identify if a trap has been set or whether or not you can charm your way out of an unnecessary fight. Often times than not, there is the chance that a critical fail (a d20 roll of 1) can occur. When this happens, you fail to hit your opponent and trip over yourself during combat, miss the trap and activate it killing someone in your party, or pissing off the non-playable character (NPC) and having them attack you. Not only will something go wrong, it will go wrong spectacularly. So, it’s only natural that we look at the d20 that was rolled and ask, “Is my d20 killing me?”
Luckily, there is a statistical test that we can use to answer this common question.
CHI SQUARE TEST
The chi square test is one of the most common statistical tests performed in sciences. In its simplest form, the chi square test is used to detect whether the observed frequencies are different from the expected frequencies across different categories. For example, in a 6-sided dice, the probability that the number 6 will land is 16.7% or 1/6. This is true for every value of the 6-sided dice if it was unbiased.

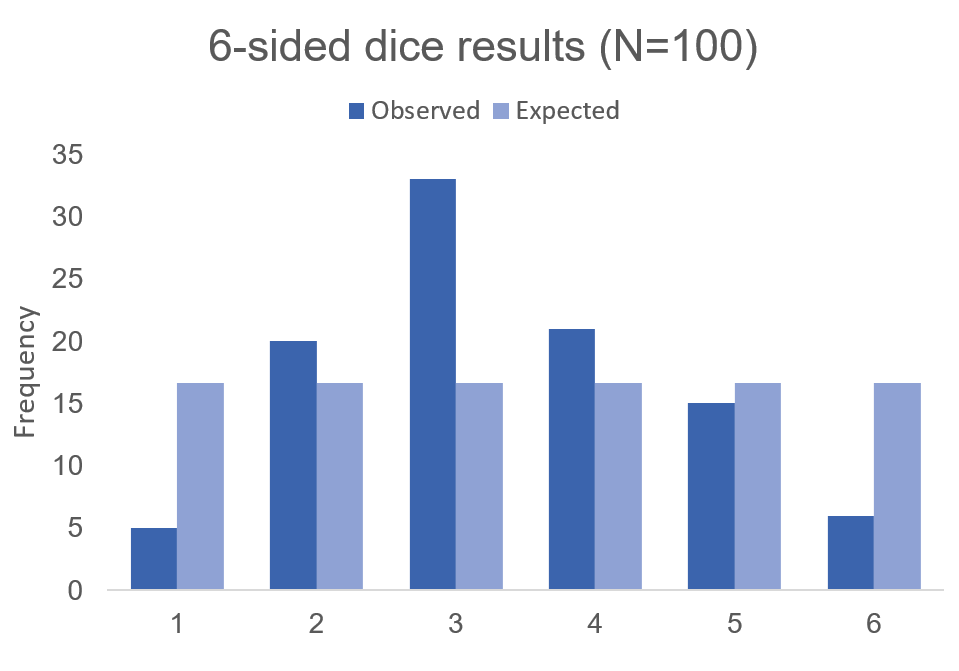
But what if the dice was biased? Suppose we roll the 6-sided dice 100 times and we get the following results:

Visually, we can see that there is some bias with this 6-sided dice. We don’t know what the bias is, but there is a something causing this dice to roll a “3” more times than it should (approximately 2 more times than normal). Alternatively, this 6-sided dice is rolling a value of “1” less times than it should (approximately 70% less likely compared to the expected frequency).
Using these data, we can perform a chi-squared test.
First, we use the following formula:
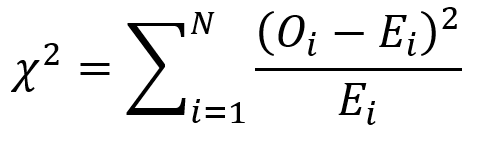
where O is the observed frequency for position i and E is the expected frequency for position i.
We need another piece of information, degrees of freedom. To estimate the degrees of freedom, we use the following equation: df = (R-1) * (C-1), where R = number of rows and C = number of columns. For the 6-sided dice, the df = (2-1) * (6-1) = 5
We can set up the formula using the following table.
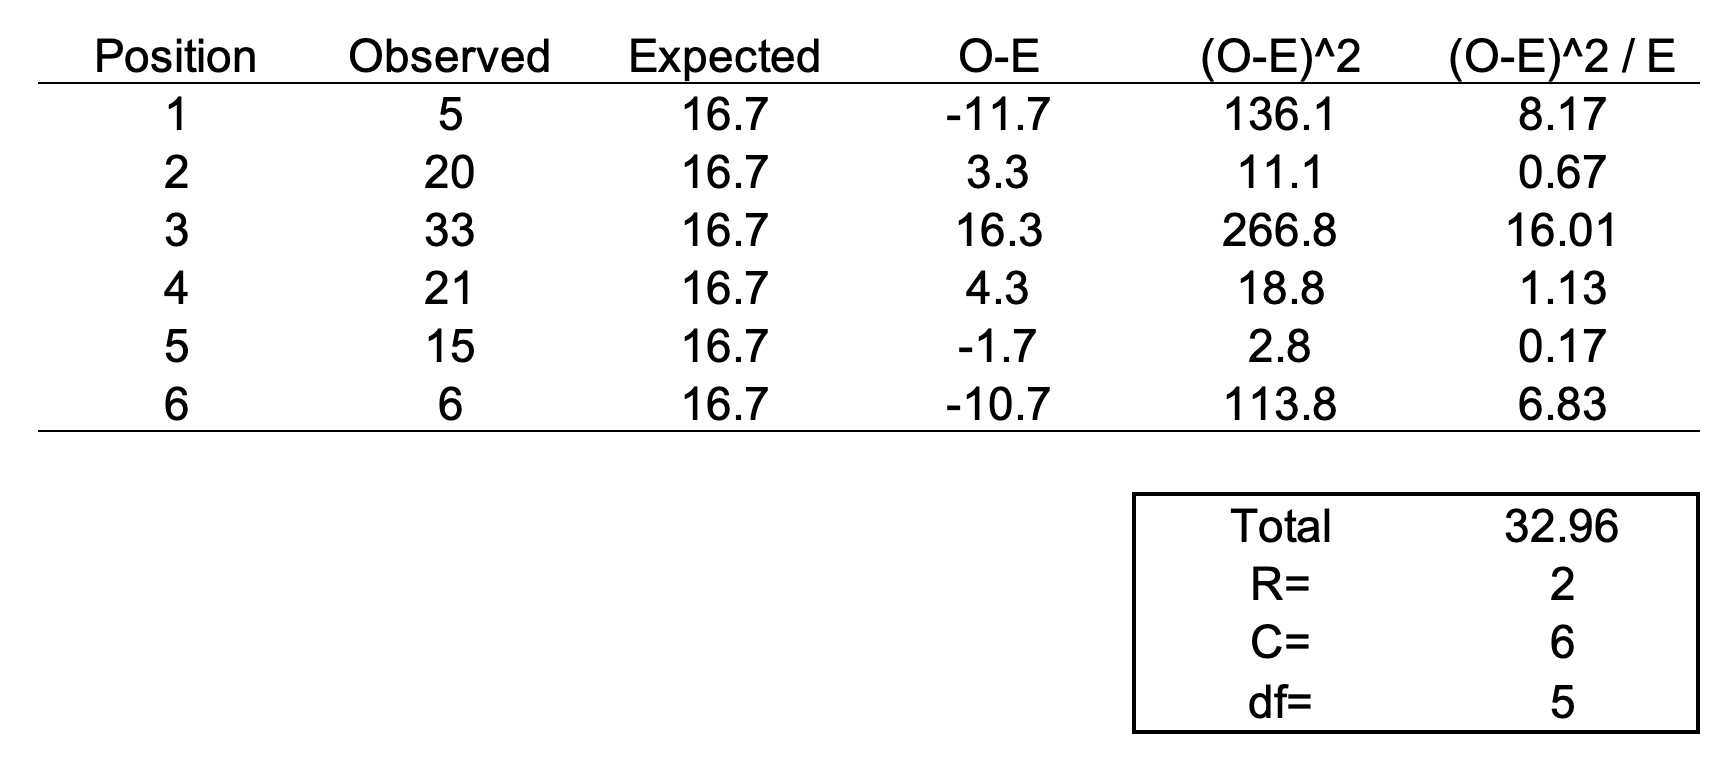
The total value of 32.96 is the chi square statistic. We will need to use the chi square distribution table to determine the p-value. Next, we need to use a chi square table like the one shown below.

So, with a degree of freedom of 5 and a chi square statistic of 32.96, the probability of a more extreme test statistics than the one observed is less 1% assuming that there were no differences. In other words, the dice is definitely bias at the type I error of 5%. I should throw away this dice.
MOTIVATING EXAMPLE
Now, let’s do this for a 20-sided dice. I’m not going to actually roll the dice 100 times, but I will generate a simulation.
> #######################################################################
> ## Simulate a d20 dice roll with 100 trials
> #######################################################################
> sims <- sample(x = 1:20, size=100, replace=TRUE)
>
> ## Generate frequency table
> table(sims)
sims
 1  2  3  4  5  6  7  8  9 10 11 12 13 14 15 16 17 18 19 20
 6  8  2  2  3  2  2  6  7  3  4  8  8  6  3  7  7  4  5  7
>
> ## Generate probability table
> prob <- table(sims) / length(sims)
>
> ## Plot the frequency of the rolls
> plot(table(sims), xlab = 'd20 rolls', ylab = 'Frequency', main = 'Frequency of events for each possible d20 roll (Trials=100)')
>
> ## Plot the probability of the rolls
> plot(prob, xlab = 'd20 rolls', ylab = 'Frequency', main = 'Probability of events for each possible d20 roll (Trials=100)')
>
> ## Perform chi square test
> chi2 <- chisq.test(table(sims))
> chi2

    Chi-squared test for given probabilities

data:  table(sims)
X-squared = 19.2, df = 19, p-value = 0.4441
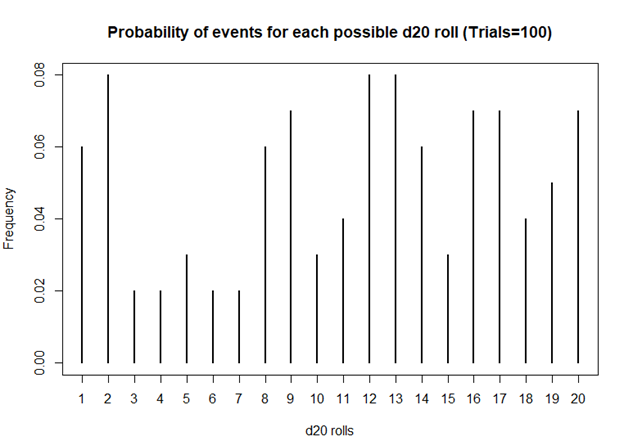
Based on this first simulation run of 100 rolls, the dice is fairly unbiased.
Let’s try 1000 rolls.
> #######################################################################
> ## Simulate a d20 dice roll with 1000 trials
> #######################################################################
> sims <- sample(x = 1:20, size=1000, replace=TRUE)
>
> ## Generate frequency table
> table(sims)
sims
 1  2  3  4  5  6  7  8  9 10 11 12 13 14 15 16 17 18 19 20
51 45 41 54 55 54 33 50 48 46 44 56 50 64 43 49 50 49 54 64
>
> ## Generate probability table
> prob <- table(sims) / length(sims)
>
> ## Plot the frequency of the rolls
> plot(table(sims), xlab = 'd20 rolls', ylab = 'Frequency', main = 'Frequency of events for each possible d20 roll (Trails = 1000)')
>
> ## Plot the probability of the rolls
> plot(prob, xlab = 'd20 rolls', ylab = 'Frequency', main = 'Probability of events for each possible d20 roll (Trials=1000)')
>
> ## Perform chi square test
> chi2 <- chisq.test(table(sims))
> chi2

    Chi-squared test for given probabilities

data:  table(sims)
X-squared = 20.08, df = 19, p-value = 0.3898
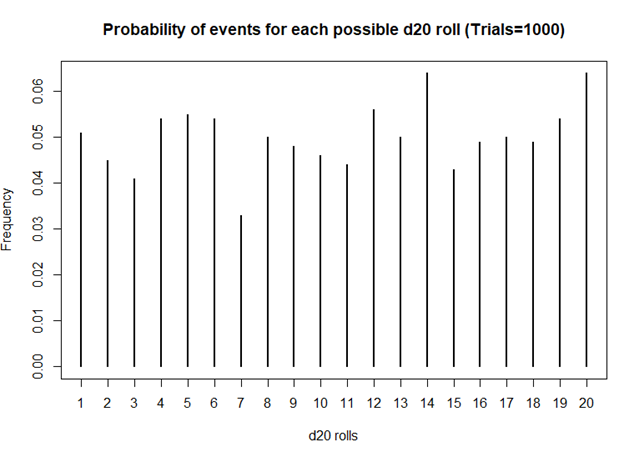
Still unbiased. But notice how the frequencies for each value of the d20 dice is starting to have similar frequencies. Unlike the previous frequency figure where there were more fluctuations, you see less of it with more rolls.
How about 10,000 rolls?
> #######################################################################
> ## Simulate a d20 dice roll with 10,000 trials
> #######################################################################
> sims <- sample(x = 1:20, size=10000, replace=TRUE)
>
> ## Generate frequency table
> table(sims)
sims
  1   2   3   4   5   6   7   8   9  10  11  12  13  14  15  16  17  18  19  20
496 477 518 469 504 492 491 551 507 499 474 527 519 532 493 506 503 473 509 460
>
> ## Generate probability table
> prob <- table(sims) / length(sims)
>
> ## Plot the frequency of the rolls
> plot(table(sims), xlab = 'd20 rolls', ylab = 'Frequency', main = 'Frequency of events for each possible d20 roll (Trails = 10,000)')
>
> ## Plot the probability of the rolls
> plot(prob, xlab = 'd20 rolls', ylab = 'Frequency', main = 'Probability of events for each possible d20 roll (Trials=10,000)')
>
> ## Perform chi square test
> chi2 <- chisq.test(table(sims))
> chi2

    Chi-squared test for given probabilities

data:  table(sims)
X-squared = 19.872, df = 19, p-value = 0.4023
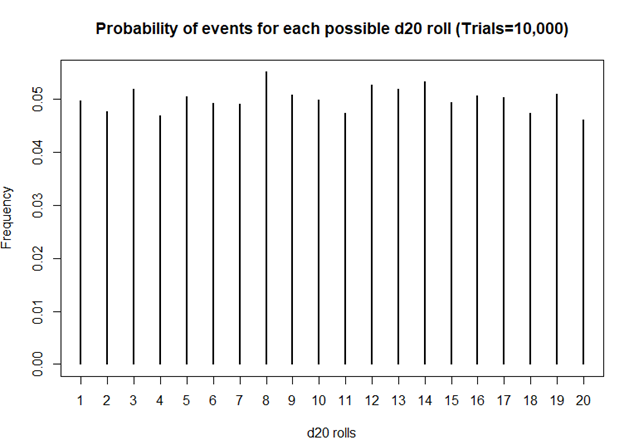
Definitely smoother. As we perform more and more rolls of the d20, we get a nearly equal number of rolls for each value.
A BIASED EXAMPLE: IS MY D20 TRYING TO KILL ME?
What if the dice was actually bias? What then? Let’s use another d20 dice and simulate the probability that the roll will be a critical fail 80% of the time.
> #######################################################################
> ## Simulate a d20 dice roll with 10000 trials -- BIASED sample
> ## This is a biased d20 where the number 1 has an 80% probability of hitting.
> #######################################################################
> sims <- sample(x = 1:20, size=10000, prob=c(0.8, 0.01052632, 0.01052632, 0.01052632, 0.01052632, 0.01052632, 0.01052632, 0.01052632, 0.01052632, 0.01052632, 0.01052632, 0.01052632, 0.01052632, 0.01052632, 0.01052632, 0.01052632, 0.01052632, 0.01052632, 0.01052632, 0.01052632), replace=TRUE)
>
> ## Generate frequency table
> table(sims)
sims
   1    2    3    4    5    6    7    8    9   10   11   12   13   14   15   16   17   18   19   20
7952   99  104  111  111  104  120  109   98   93  107   99  107  110  116  109  118  122  104  107
>
> ## Generate probability table
> prob <- table(sims) / length(sims)
>
> ## Plot the frequency of the rolls
> plot(table(sims), xlab = 'd20 rolls', ylab = 'Frequency', main = 'Frequency of events for each possible d20 roll (Trials=10,000)')
>
> ## Plot the probability of the rolls
> plot(prob, xlab = 'd20 rolls', ylab = 'Frequency', main = 'Probability of events for each possible d20 roll (Trials=10,000)')
>
> ## Perform chi square test
> chi2 <- chisq.test(table(sims))
> chi2

    Chi-squared test for given probabilities

data:  table(sims)
X-squared = 116910, df = 19, p-value < 2.2e-16
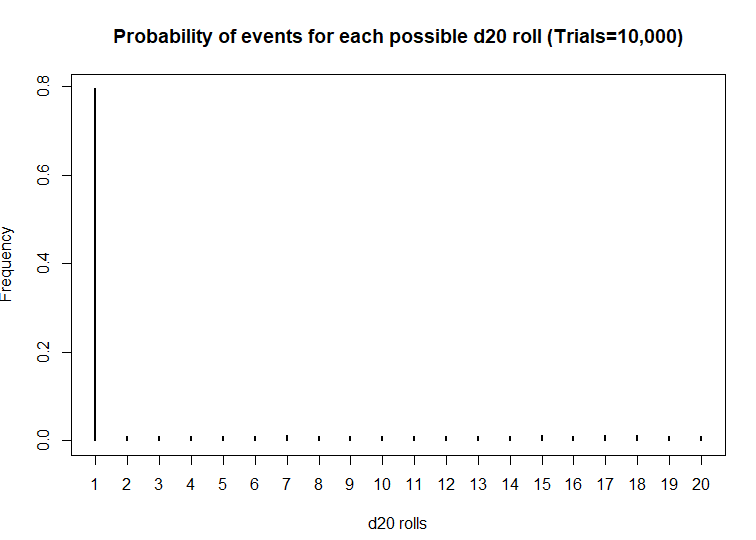
Wow! This d20 is really biased! At a statistical significance threshold that is less than 5%, the very small P-value (P<2.2 x 10^-16) indicates that this d20 is statistically biased from from a fair d20. Maybe that’s why I have more critical fails than any member in my party. I definitely will not be using this dice in the future.
CONCLUSIONS
The chi square test has a lot of usefulness in explaining the bias with anything that provides frequencies of rolls or events. You can use the chi square test for a variety of things such as the fairness of a coin, the differences in the frequency of male and female across different character classes, and determine whether the actual observations matches what you expected. So, when you’re playing D&D with your friends and you suspect that your d20 is rolling a critical fail more often than naught, you may want to run a little experient using the chi square test.
The R code can be found on my GitHub site.
REFERENCES
I had help writing this blog. The codes for the chi square simulation came from Francis J. DiTraglia, Assistant Professor of Economics from the University of Pennsylvania. His website is here. The page where I found his codes is here.
For those interested in probability and games, you should check out this great resource from the Mathematics Assessment Resource Service at the University of Nottingham & UC Berkeley. It uses mathematics to design several games of chance. Fun to do in between campaigns.
And for those who want a more academic presentation on RPGs, Paul Mason wrote an incredible piece that can be found here. Citation: Mason, Paul. 2012. "A History of RPGs: Made by Fans; Played by Fans." Transformative Works and Cultures, no. 11. http://dx.doi.org/10.3983/twc.2012.0444