BACKGROUND
Data visualization has evolved into sophisticated interactive graphics where users can gather more information compared to simple two-dimensional graphics. Color has become an important element to data visualization adding another dimension of information and data. However, people with color vision deficiency (also known as “color blindness”) are unable to experience or benefit from the use of colors in data visualization. This can have important implications when developing our data visualization, which is meant to inform and educate. To maximize the uptake and adoption of our tools and reports with data visualization, we need to consider using color blind friendly palettes.
Recently, I created a report using the RColorBrewer color palette, which contains three types of color palettes: sequential, diverging, and qualitative. This color palette package in R was developed by Cynthia Brewer, and you can experiment with different color combinations at https://colorbrewer2.org.
Sequential palettes are used for ordered data which are represented varying gradient levels of color. For example, a low order might be represented by a light shade of blue, but a high order might be represented by a darker shade of blue (Figure 1).
Figure 1. Example of a sequential palette
Diverging palettes are used to put equal emphasis on the mid-range values with the ends denoted by contrasting hues. For example, using colors to represent the values between 1 and 5 where 3 is the mid-range, we could color 3 as White, 1 as Blue, and 5 as Red (Figure 2).
Figure 2. Example of a diverging palette
Qualitative palettes are used to on categorical data, and the colors are used to represent distinct categories. Suppose you have a variable called food and there are 5 categories in that variable (chicken, meat, fish, vegetables, and fruit). You can use different hues to represent each category (Figure 3)
COLOR VISION DEFICIENCY
Color vision deficiency affects approximately 8% of males and 0.4% of females in the general population who are of European descent.1 However, these numbers vary among other races. For example, the prevalence of color vision deficiency among males in China and Japan are 4% and 6.5%, respectively.
There are several types of color vision deficiency. The red-green color vision deficiency is the most common, which are classified as protanomaly for red weakness and deuteranomaly for green weakness.2 For red-blind and green-blind, the categories are protanopia and deuteranopia, respectively. Less prevalent are the blue-weakness/blind (tritanomaly and tritanopia) and complete absence of color vision (achromatopsia). Examples of the different types of color vision deficiency are provided in the figure below (Figure 4).
Figure 4. Examples of color vision deficiency.
POTENTIAL SOLUTIONS
Picking color palettes that would not affect readers with color vision deficiency is not easy. Particularly, when you have a lot of colors on the palette that you are using. One tool that is helpful is ColorBrewer 2.0. You can select the “colorblind safe” option to select color palettes are friendly for readers with color vision deficiency (Figure 5).
Figure 5. ColorBrewer options. Source: https://colorbrewer2.org/
Another method to generate data visualizations for readers with color vision deficiency is to use different line styles or shapes. For example, we can use different types of dashed lines and markers for this line chart (Figure 6).
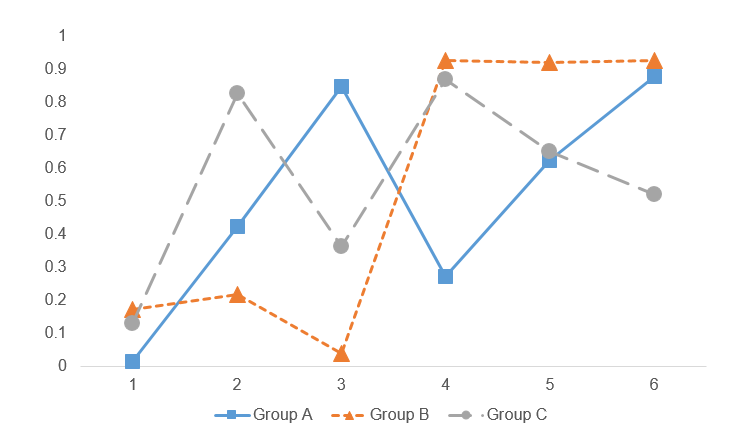
Figure 6. Line chart using different dash line types and markers (square, triangle, and circle).
CONCLUSIONS
Color vision deficiency can hinder our readers from extracting information from our data visualization. Hence, it is critical that we generate data visualization using the methods above to help our audience. Using the correct color palette and varying the style of the figures by changing the line styles (e.g., dashed) or marker shapes, can assist our readers regardless of their color vision deficiency. More importantly, it will help to reduce any barriers to accessing vital information for our entire audience.
ACKNOWLEDGMENTS
I used the Coblis-Color Blindness Simulator to generate the varying color vision deficiency examples in Figure 4.
REFERENCES
1. Birch J. Worldwide prevalence of red-green color deficiency. J Opt Soc Am A Opt Image Sci Vis. 2012;29(3):313-320. doi:10.1364/JOSAA.29.000313
2. Chakrabarti S. Psychosocial aspects of colour vision deficiency: Implications for a career in medicine. Natl Med J India. 2018;31(2):86-96. doi:10.4103/0970-258X.253167