SUMMARY
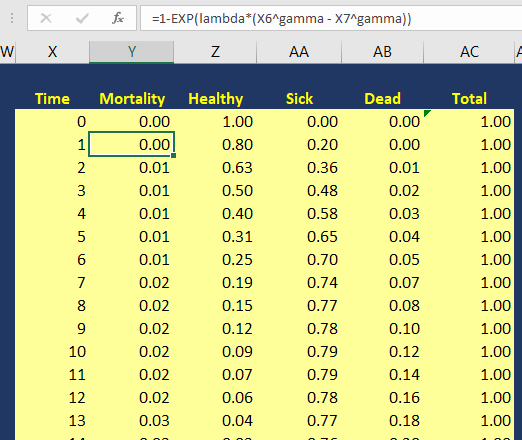
After extrapolating the survival curve beyond the reference Kaplan-Meier curve limit of 40 months, you can estimate the lifetime horizon for a cohort of patients using a Markov model. This method is very useful when simulating chronic diseases. However, it is always good practice to calibrate your survival curves with the most recent data on the population of interest.
The U.S. National Center for Health Statistics has life tables that you can use to estimate the life expectancy of the general population, which you can compare to your simulated cohort. Moreover, if you want to compare your simulated cohort’s survival performance to a reference specific to your chronic disease cohort, you can search the literature for previously published registry data or epidemiology studies. Using existing studies as a reference will allow you to make adjustments to your survival curves that will give them credibility and validation to your cost-effectiveness analysis.
CONCLUSIONS
Using the Kaplan-Meier curves from published sources can help you to generate your own time-varying survival curves for use in a Markov model. Using the Hoyle and Henley’s Excel template to generate the survival probabilities, which are then used in an R script to generate the lambda and gamma parameters, provides a powerful tool to integrate Weibull parameters into a Markov model. Moreover, we can take advantage of the Weibull distribution to extrapolate the survival probability over the cohort’s lifetime giving us the ability to model lifetime horizons.
The Excel template developed by Hoyle and Henley generates other parameters that can be used in probabilistic sensitivity analysis like the Cholesky decomposition matrix, which will be discuss in a later blog.
REFERENCES
Location of Excel spreadsheet developed by Hoyle and Henley (Update 02/17/2019: I learned that Martin Hoyle is not hosting this on his Exeter site due to a recent change in his academic appointment. For those interested in getting access to the Excel spreadsheet used in this blog, please download it at this link).
Location of the Markov model used in this exercise is available in the following link:
https://www.dropbox.com/sh/ztbifx3841xzfw9/AAAby7qYLjGn8ZfbduJmAsVva?dl=0
Symmetry Solutions. “Engauge Digitizer—Convert Images into Useable Data.” Available at the following url: https://www.youtube.com/watch?v=EZTlyXZcRxI
Engauge Digitizer: Mark Mitchell, Baurzhan Muftakhidinov and Tobias Winchen et al, "Engauge Digitizer Software." Webpage: http://markummitchell.github.io/engauge-digitizer [Last Accessed: February 3, 2018].
Hoyle MW, Henley W. Improved curve fits to summary survival data: application to economic evaluation of health technologies. BMC Med Res Methodol 2011;11:139.
ACKNOWLEDGMENTS
I want to thank Solomon J. Lubinga for helping me with my first attempt to use Weibull curves in a cost-effectiveness analysis. His deep understanding and patient tutelage are characteristics that I aspire to. I also want to thank Elizabeth D. Brouwer for her comments and edits, which have improved the readability and flow of this blog. Additionally, I want to thank my doctoral dissertation chair, Beth Devine, for her edits and mentorship.


