Methods

Formulating a good research question

On April 16, 2020, I gave a presentation to students from the International Society for Pharmacoeconomics and Outcomes Research (ISPOR) Student Chapter at the University of Washington’s Comparative Health Outcomes, Policy, & Economics (CHOICE) Institute. I reviewed some of the ways to think about a research topic, how to narrow the scope of the topic, and how to formulate a specific and testable research question. The presentation was meant to help students develop their own process for developing a good research question for their thesis.

I discussed the FINER criteria for formulating a research question

FINER criteria.png

I also discussed the PICOT format of a research question.

PICOT.png

The presentation is available on the CHOICE Institute’s blog: https://choiceblog.org/2020/04/27/best-practices-in-developing-research-questions/

Cobb-Douglas production function and costs minimization problem

Update 2: This article was updated on 12 August 2023 when Dimanjan Dahal (Twitter account) identified a better way to present the Lagrangian functions. I updated this to better reflect the minimization problem and set the partial derivative solution to 0. Thank you, Dimanhan.

Update 1: This article was updated on 11 October 2021 when an anonymous reader identified an error with the example used at the end. The error was the negative value generated for the output elasticity of capital. In the previous example, I used R to generate a set of random numbers that were used in a regression model. The beta coefficient generated a negative value which was used in the linear form of the Cobb-Douglass equation. Since the output of elasticity should be between the values of 0 and 1, this negative coefficient should not be possible. Hence, I’ve updated the data frame used in the example to avoid this issue. Appreciation goes out to the anonymous reader who identified this error.

INTRODUCTION

The Cobb-Douglas (CD) production function is an economic production function with two or more variables (inputs) that describes the output of a firm. Typical inputs include labor (L) and capital (K). It is similarly used to describe utility maximization through the following function [U(x)]. However, in this example, we will learn how to answer a minimization problem subject to (s.t.) the CD production function as a constraint.

The functional form of the CD production function:

 
Figure1.png
 

where the output Y is a function of labor (L) and capital (K), A is the total factor productivity and is otherwise a constant, L denotes labor, K denotes capital, alpha represents the output elasticity of labor, beta represents the output elasticity of capital, and (alpha + beta = 1) represents the constant returns to scale (CRS). The partial derivative of the CD function with respect to (w.r.t) labor (L) is:

 
Figure2.png
 

Recall that quantity produced is based on the labor and capital; therefore, we can solve for alpha:

 
Figure3.png
 

This will yield the marginal product of labor (L). If alpha = 2, then a 10% increase in labor (L) will result in a 20% increase in output (Y).

The partial derivative of the CD function with respect to (w.r.t) labor (K) is:

 
Figure4.png
 

This will yield the marginal product of capital (K).

The CD production function can be converted to a linear model by taking the logarithm of both sides of the equation:

 
Figure5.png
 

This will allow for OLS regression methods, which is commonly used in economics to understand the association between inputs (L and K) on production (Y).

However, what happens when we are interested in the marginal cost with respect to (w.r.t.) production (Y)? This becomes a constraint (cost) minimization problem where the firm can control how much L and K they will use. In other words, we want to minimize the cost subject to (s.t.) the output

 
Figure6.png
 

Cost becomes a function of wage (w), the amount of labor (L), price of capital (r), and the amount of capital (K). To determine the optimal amount of inputs (L and K), we solve this minimization constraint using the Lagrange multiplier method:


Solve for L

 
Figure8.png
 

Substitute L in the constraint term (CD production function) in order to solve for K

 
Figure9.png
 

Now, we can completely solve for L (as a function of Y, A, w, and r) by substituting for K

 
Figure10.png
 

Substitute L and K into the cost minimization problem

 
Figure11.png
 

Simplify

 
Figure12.png
 

Final cost function

 
Figure13.png
 

Let’s see how we can use the results from a regression model to give us information about the total costs w.r.t. to the quantity produced.

Recall the linear form of the Cobb-Douglas production function:

 
Figure14.png
 

I simulated some data where we have the capital, labor, and quantity produced in R.

## Use the following libraries: library(jtools) library(broom) library(ggstance) library(broom.mixed) ## Generate random data for the data frame (cddata) set.seed(1234) production <- sample(100:600, 30, replace=TRUE) labor <- sample(50:350, 30, replace=TRUE) capital <- sample(6000:7000, 30, replace=TRUE) ## Cost function parameters: wage and price constants wage <- 35.00 price <- 30.00 ## Set up the data frame (cddata): cddata <- data.frame(production = production, labor = labor, capital = capital, wage = wage, price = price) ## Name rows using some timeline from 1988 to 2017 (30 years for 30 observations for each variable): row.names(cddata) <- 1988:2017

Then I perform a regression model using OLS

## Setting up the model, where log(a) is eliminated due to it being the intercept. cd.lm <- lm(formula = log(production) ~ log(labor) + log(capital), data = cddata) summary(cd.lm) Residuals: Min 1Q Median 3Q Max -0.96586 -0.25176 0.06148 0.37513 0.67433 Coefficients: Estimate Std. Error t value Pr(>|t|) (Intercept) 4.44637 17.41733 0.255 0.800 log(labor) 0.14373 0.23595 0.609 0.548 log(capital) 0.05581 2.00672 0.028 0.978 Residual standard error: 0.5065 on 27 degrees of freedom Multiple R-squared: 0.01414, Adjusted R-squared: -0.05888 F-statistic: 0.1937 on 2 and 27 DF, p-value: 0.8251

After running the model, I stored the coefficients for use later in the production function.

## Store the coefficients
coeff <- coef(cd.lm)

## Assign the values to the production function parameters where Y = AL^(alpha)K^(beta)
intercept <- coeff[1]
alpha <- coeff[2]
beta <- coeff[3]

From the parameters, we can get A (intercept), alpha (log(labor)), and beta (log(capital)).

 
linear form of CD function.jpg
 

This will give us the quantity produced (Y) for given data on labor (L) and capital (K).

We can get the total costs (C) based on the quantity produced (Y) using the cost function:

 
Figure16.png
 

I set up my R code so that I have the intercept, alpha, beta, labor, wage, and price of the capital set up. I estimated each part of the cost function separately and then multiply the parts at the end.

## Cost
PartA <- (production / intercept)^(1 / alpha + beta)
PartB <- wage^(alpha / alpha + beta)
PartC <- price^(beta / alpha + beta)
PartD <- as.complex(alpha / beta )^(beta / alpha + beta) + as.complex(beta/ alpha)^(alpha / alpha + beta)

costs <- PartA * PartB * PartC * PartD
Note: R has a problem with performing complex operations with exponents that were defined using arrays or vectors. If you try to compute something like x^{alpha}, you will get an error where the value is “NaN.” I don’t have a complete understanding of the problem, but the solution is to make sure your root or base term is preceded by “as.complex(x)” to resolve the issue.

I plot the relationship between quantity produced and cost. In other words, this tells us the lowest costs needed to produce the quantities on the plot.

plot(production, costs)
 
cost production curve.jpg
 

CONCLUSIONS

Using the Cobb-Douglas production function and the cost minimization approach, we were able to find the optimal conditions for the cost function and plot the outcome relative to the quantity produced. As production increases, the minimum cost needed increases in a non-linear, exponential fashion, which makes sense given that Y (quantity produced) is in the numerator on the right-hand side of the cost function and positively related to the cost.

This was a fun exercise that made me think about the usefulness of the Cobb-Douglas production function, which I learned to optimize multiple times in my Economics courses. I was excited to find a pleasant utility for it using simulated data and will probably explore more exercises like this in the future.

REFERENCEs

I used a lot of resources to write this blog, which are provided below.

A site dedicated to the discussion of economics called EconomicsDiscussion.net was a great resource.

These papers were incredibly helpful in preparing the example in R:

  • Lin CP. The application of Cobb-Douglas production cost functions to construction firms in Japan and Taiwan. Review of Pacific Basin Financial Markets and Policies Vol. 5, No. 1 (2002): 111–128.

  • Larriviere JB, Sandler R. A student friendly illustration and project: empirical testing of the Cobb-Douglas production function using major league baseball. Journal of Economics and Economic Education Research, Volume 13, Number 3, 2012: 81-92

  • Hu, ZH. Reliable Optimal Production Control with Cobb-Douglas Model. Reliable Computing. 1998; 4(1): 63-69.

I encountered some issues regarding complex numbers in R. Fortunately, I found some great resources about it.

  • I found a great discussion about R’s calculation of exponents and “NaN” results and why complex numbers can mess up your math in R.

  • Another good site (R Tutorial: An Introduction to Statistics) explaining complex numbers in R.

  • John Myles White wrote a nice article about complex numbers in R.

Acknowledgements: I would like to thank the user who reached out to me about the coefficient errors for the output elasticity of capital. This helps me to learn my mistakes and correct them. Without the support and guidance from the community, I would not achieve my own goals of being a lifelong learner. Thank you.

Is my d20 killing me? – using the chi square test to determine if dice rolls are bias

BACKGROUND

Every Tuesdays, my friends and I enjoy playing role playing games (RPGs), especially table top RPGs such as Dungeons & Dragons (D&D). Every week, we get together and pull out our laptops, character sheets, and review our previous notes to return to the fictional fantasy worlds we created (or were created for us) and do battle, solve mysteries, and tell stories over some ciders (and Le Croix). This ritual is important because it allows us to disconnect from the real world and allow our imaginations to run wild. After every session, we think about the various actions that took place and review how things would have been different if the roll of a dice went a different way.

I first started playing D&D Second Edition when I was a kid after I was exposed to it at a comic book store (Golden Apple Comics in Los Angeles). I still remember the strange colorful dice rolling on a table top mat and people scratching away at paper using stats that I wasn’t familiar with. In high school, my friends and I would play different campaigns from the D&D and Forgotten Realms worlds, creating characters based on rule books using statistics and probabilities. The key ingredient with any adventure is having your fate determined by a single dice roll. The iconic dice in RPG is the d20 or the 20-sided dice. A d20 dice is usually used to determine whether you “hit” your opponent, use your skills to identify if a trap has been set or whether or not you can charm your way out of an unnecessary fight. Often times than not, there is the chance that a critical fail (a d20 roll of 1) can occur. When this happens, you fail to hit your opponent and trip over yourself during combat, miss the trap and activate it killing someone in your party, or pissing off the non-playable character (NPC) and having them attack you. Not only will something go wrong, it will go wrong spectacularly. So, it’s only natural that we look at the d20 that was rolled and ask, “Is my d20 killing me?”

Luckily, there is a statistical test that we can use to answer this common question.


CHI SQUARE TEST

The chi square test is one of the most common statistical tests performed in sciences. In its simplest form, the chi square test is used to detect whether the observed frequencies are different from the expected frequencies across different categories. For example, in a 6-sided dice, the probability that the number 6 will land is 16.7% or 1/6. This is true for every value of the 6-sided dice if it was unbiased.

Figure 1.png

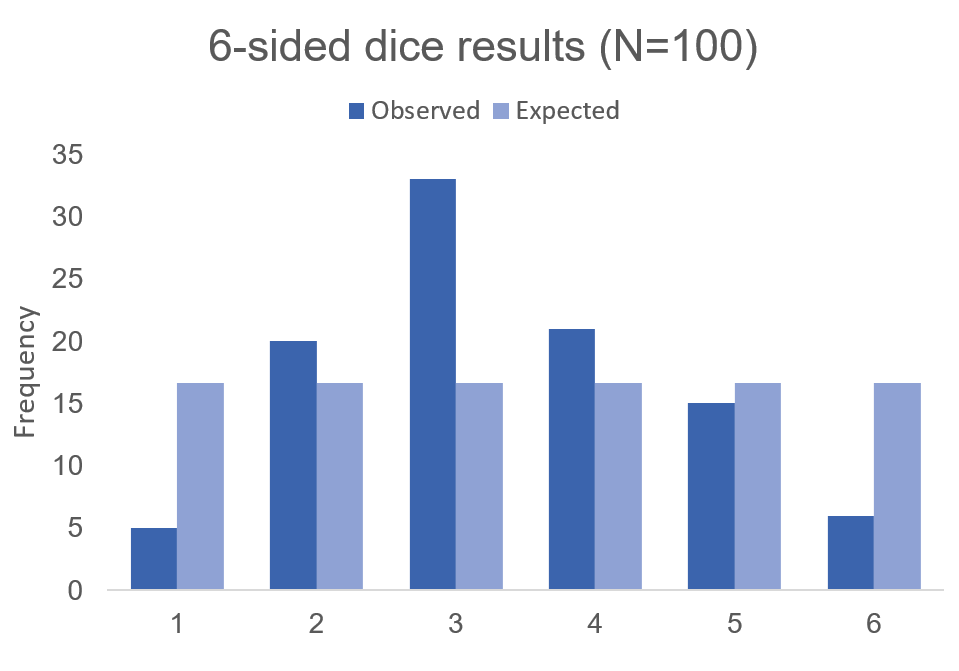
But what if the dice was biased? Suppose we roll the 6-sided dice 100 times and we get the following results:

Figure 2.png

Visually, we can see that there is some bias with this 6-sided dice. We don’t know what the bias is, but there is a something causing this dice to roll a “3” more times than it should (approximately 2 more times than normal). Alternatively, this 6-sided dice is rolling a value of “1” less times than it should (approximately 70% less likely compared to the expected frequency).

Figure 3.png

Using these data, we can perform a chi-squared test.

First, we use  the following formula:

 
Chi square.png
 

where O is the observed frequency for position i and E is the expected frequency for position i.

We need another piece of information, degrees of freedom. To estimate the degrees of freedom, we use the following equation: df = (R-1) * (C-1), where R = number of rows and C = number of columns. For the 6-sided dice, the df = (2-1) * (6-1) = 5

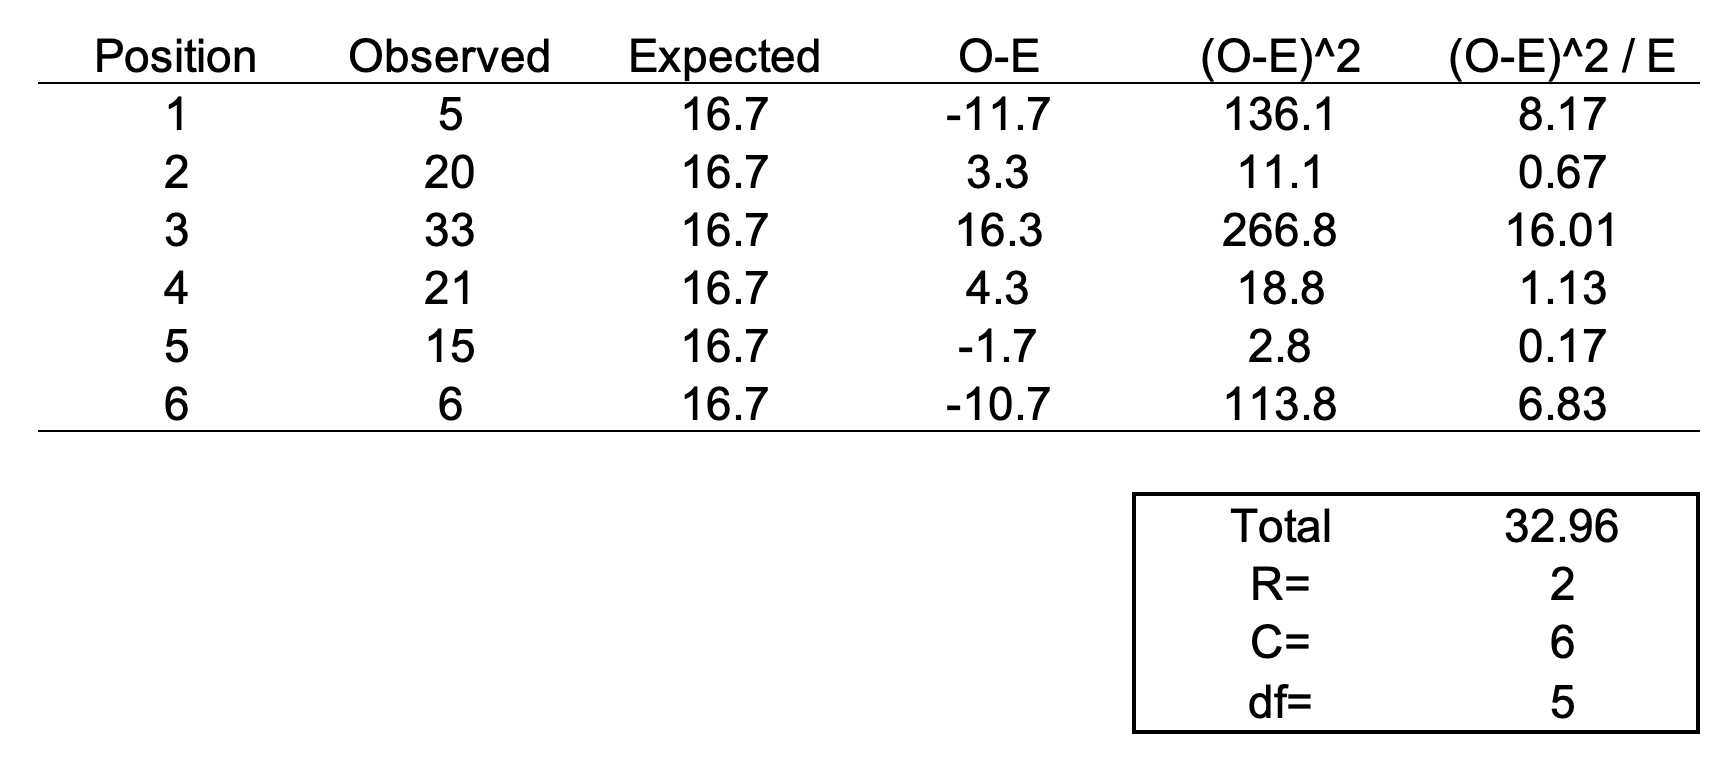
We can set up the formula using the following table.

Figure 4.png

The total value of 32.96 is the chi square statistic. We will need to use the chi square distribution table to determine the p-value. Next, we need to use a chi square table like the one shown below.

Figure 5.png

So, with a degree of freedom of 5 and a chi square statistic of 32.96, the probability of a more extreme test statistics than the one observed is less 1% assuming that there were no differences. In other words, the dice is definitely bias at the type I error of 5%. I should throw away this dice.


MOTIVATING EXAMPLE

Now, let’s do this for a 20-sided dice. I’m not going to actually roll the dice 100 times, but I will generate a simulation.

> #######################################################################
> ## Simulate a d20 dice roll with 100 trials
> #######################################################################
> sims <- sample(x = 1:20, size=100, replace=TRUE)
> 
> ## Generate frequency table
> table(sims)
sims
 1  2  3  4  5  6  7  8  9 10 11 12 13 14 15 16 17 18 19 20 
 6  8  2  2  3  2  2  6  7  3  4  8  8  6  3  7  7  4  5  7 
> 
> ## Generate probability table
> prob <- table(sims) / length(sims)
> 
> ## Plot the frequency of the rolls
> plot(table(sims), xlab = 'd20 rolls', ylab = 'Frequency', main = 'Frequency of events for each possible d20 roll (Trials=100)')
> 
> ## Plot the probability of the rolls
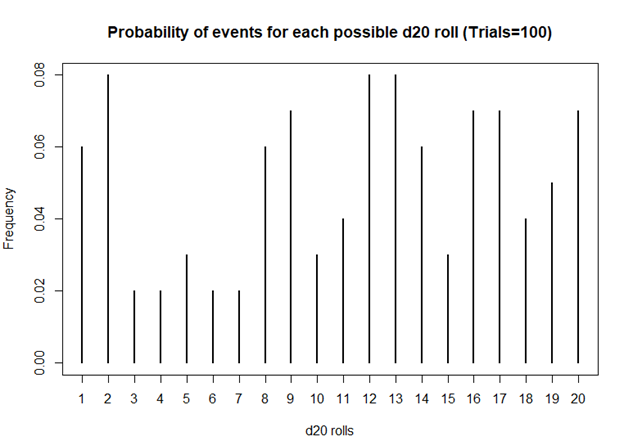
> plot(prob, xlab = 'd20 rolls', ylab = 'Frequency', main = 'Probability of events for each possible d20 roll (Trials=100)')
> 
> ## Perform chi square test
> chi2 <- chisq.test(table(sims))
> chi2

    Chi-squared test for given probabilities

data:  table(sims)
X-squared = 19.2, df = 19, p-value = 0.4441
Figure 6.png

Based on this first simulation run of 100 rolls, the dice is fairly unbiased.

Let’s try 1000 rolls.

> #######################################################################
> ## Simulate a d20 dice roll with 1000 trials
> #######################################################################
> sims <- sample(x = 1:20, size=1000, replace=TRUE)
> 
> ## Generate frequency table
> table(sims)
sims
 1  2  3  4  5  6  7  8  9 10 11 12 13 14 15 16 17 18 19 20 
51 45 41 54 55 54 33 50 48 46 44 56 50 64 43 49 50 49 54 64 
> 
> ## Generate probability table
> prob <- table(sims) / length(sims)
> 
> ## Plot the frequency of the rolls
> plot(table(sims), xlab = 'd20 rolls', ylab = 'Frequency', main = 'Frequency of events for each possible d20 roll (Trails = 1000)')
> 
> ## Plot the probability of the rolls
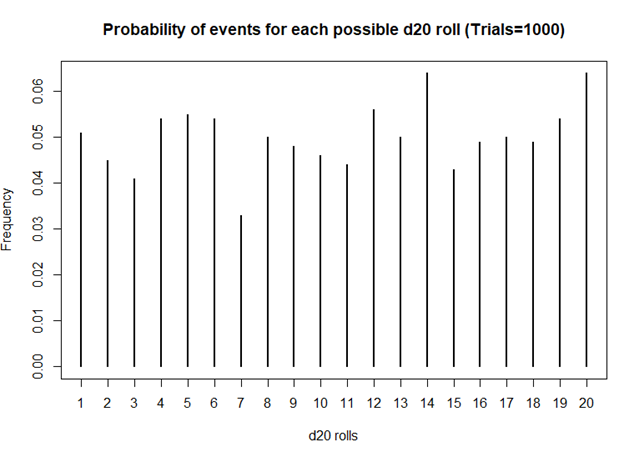
> plot(prob, xlab = 'd20 rolls', ylab = 'Frequency', main = 'Probability of events for each possible d20 roll (Trials=1000)')
> 
> ## Perform chi square test
> chi2 <- chisq.test(table(sims))
> chi2

    Chi-squared test for given probabilities

data:  table(sims)
X-squared = 20.08, df = 19, p-value = 0.3898
Figure 7.png

Still unbiased. But notice how the frequencies for each value of the d20 dice is starting to have similar frequencies. Unlike the previous frequency figure where there were more fluctuations, you see less of it with more rolls.

How about 10,000 rolls?

> #######################################################################
> ## Simulate a d20 dice roll with 10,000 trials
> #######################################################################
> sims <- sample(x = 1:20, size=10000, replace=TRUE)
> 
> ## Generate frequency table
> table(sims)
sims
  1   2   3   4   5   6   7   8   9  10  11  12  13  14  15  16  17  18  19  20 
496 477 518 469 504 492 491 551 507 499 474 527 519 532 493 506 503 473 509 460 
> 
> ## Generate probability table
> prob <- table(sims) / length(sims)
> 
> ## Plot the frequency of the rolls
> plot(table(sims), xlab = 'd20 rolls', ylab = 'Frequency', main = 'Frequency of events for each possible d20 roll (Trails = 10,000)')
> 
> ## Plot the probability of the rolls
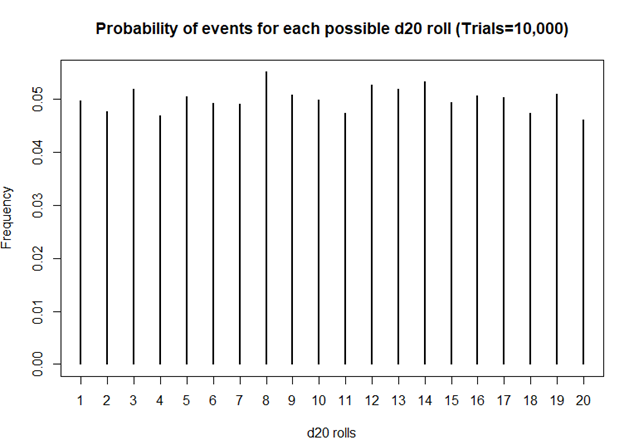
> plot(prob, xlab = 'd20 rolls', ylab = 'Frequency', main = 'Probability of events for each possible d20 roll (Trials=10,000)')
> 
> ## Perform chi square test
> chi2 <- chisq.test(table(sims))
> chi2

    Chi-squared test for given probabilities

data:  table(sims)
X-squared = 19.872, df = 19, p-value = 0.4023
Figure 8.png

Definitely smoother. As we perform more and more rolls of the d20, we get a nearly equal number of rolls for each value.


A BIASED EXAMPLE: IS MY D20 TRYING TO KILL ME?

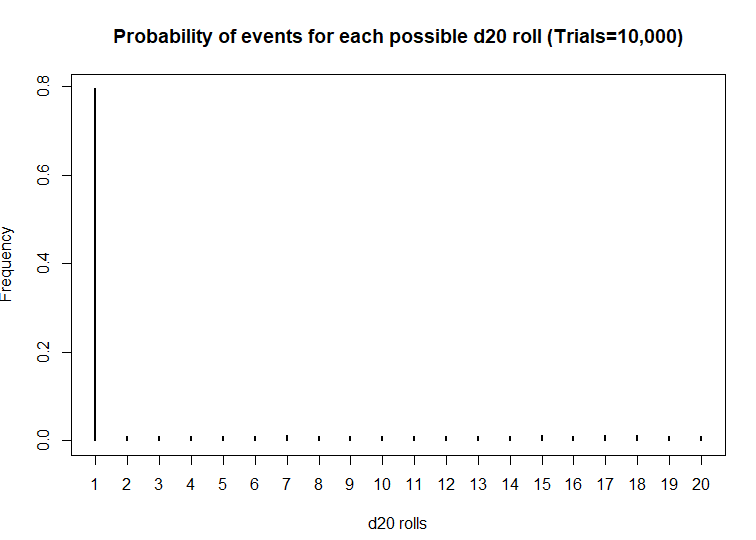
What if the dice was actually bias? What then? Let’s use another d20 dice and simulate the probability that the roll will be a critical fail 80% of the time.

> #######################################################################
> ## Simulate a d20 dice roll with 10000 trials -- BIASED sample
> ## This is a biased d20 where the number 1 has an 80% probability of hitting.
> #######################################################################
> sims <- sample(x = 1:20, size=10000, prob=c(0.8, 0.01052632, 0.01052632, 0.01052632, 0.01052632, 0.01052632, 0.01052632, 0.01052632, 0.01052632, 0.01052632, 0.01052632, 0.01052632, 0.01052632, 0.01052632, 0.01052632, 0.01052632, 0.01052632, 0.01052632, 0.01052632, 0.01052632), replace=TRUE)
> 
> ## Generate frequency table
> table(sims)
sims
   1    2    3    4    5    6    7    8    9   10   11   12   13   14   15   16   17   18   19   20 
7952   99  104  111  111  104  120  109   98   93  107   99  107  110  116  109  118  122  104  107 
> 
> ## Generate probability table
> prob <- table(sims) / length(sims)
> 
> ## Plot the frequency of the rolls
> plot(table(sims), xlab = 'd20 rolls', ylab = 'Frequency', main = 'Frequency of events for each possible d20 roll (Trials=10,000)')
> 
> ## Plot the probability of the rolls
> plot(prob, xlab = 'd20 rolls', ylab = 'Frequency', main = 'Probability of events for each possible d20 roll (Trials=10,000)')
> 
> ## Perform chi square test
> chi2 <- chisq.test(table(sims))
> chi2

    Chi-squared test for given probabilities

data:  table(sims)
X-squared = 116910, df = 19, p-value < 2.2e-16
Figure 9.png

Wow! This d20 is really biased! At a statistical significance threshold that is less than 5%, the very small P-value (P<2.2 x 10^-16) indicates that this d20 is statistically biased from from a fair d20. Maybe that’s why I have more critical fails than any member in my party. I definitely will not be using this dice in the future.


CONCLUSIONS

The chi square test has a lot of usefulness in explaining the bias with anything that provides frequencies of rolls or events. You can use the chi square test for a variety of things such as the fairness of a coin, the differences in the frequency of male and female across different character classes, and determine whether the actual observations matches what you expected. So, when you’re playing D&D with your friends and you suspect that your d20 is rolling a critical fail more often than naught, you may want to run a little experient using the chi square test.

The R code can be found on my GitHub site.


REFERENCES

I had help writing this blog. The codes for the chi square simulation came from Francis J. DiTraglia, Assistant Professor of Economics from the University of Pennsylvania. His website is here. The page where I found his codes is here.

For those interested in probability and games, you should check out this great resource from the Mathematics Assessment Resource Service at the University of Nottingham & UC Berkeley. It uses mathematics to design several games of chance. Fun to do in between campaigns.

And for those who want a more academic presentation on RPGs, Paul Mason wrote an incredible piece that can be found here. Citation: Mason, Paul. 2012. "A History of RPGs: Made by Fans; Played by Fans." Transformative Works and Cultures, no. 11. http://dx.doi.org/10.3983/twc.2012.0444


Using inverse probability of treatment weights & Marginal structural models to handle time-varying covariates

BACKGROUND

When constructing regression models, there are two approaches to handling confounders: (1) conditional and (2) marginal approaches.(1) The conditional approach handles confounders using stratification or modeling (e.g., adding covariates to be regressed to the outcome). Whereas, the marginal approach uses weights to balance the confounders across treatment exposure levels.(1–5) In conventional regression models, the exposure is regressed to the outcome controlling for potential confounders. However, in longitudinal data, time-varying confounders can result in biased estimates of the model parameters if not properly adjusted. This gets more complicated when we have a time-varying exposure in the model to account for.

In panel data analysis or longitudinal data analysis, adjusting for time-varying exposure and time-varying confounders are critical to reducing bias. Additionally, there are time-dependent relationships between the confounders and exposure that need to be considered when adjusting for longitudinal regression models. In this article, we will focus on the marginal approach in terms of using the inverse probability of treatment weights fitted to a marginal structural model.

This article was published on RPubs with the corresponding R code using RMarkdown and can be located at this link.


TIME-DEPENDENT RELATIONSHIPS

In Figure 1, the time-dependent relationships between times 1 and 0 for the treatment variable are indicated by the arrows (We look at the relationships across two time points. In actual longitudinal data, there may be more than two time points to consider). Notice how the Outcome at time==0 is a confounder for the relationship between Exposure and Outcome at time==1.

Figure 1. Time-dependent relationships between the exposure and outcome variables.

Figure 1 - time-dependent relationships.png

Conventional methods to perform longitudinal data analysis such as linear mixed effects models and generalized estimating equations models are capable of handling time-varying covariates. However, in the case of a time-varying elements, the probability of treatment exposure is invariably different across time, which requires application of time-varying weights on the unit of analysis (e.g., individual subjects).

We can address this issue by applying inverse probability of treatment weights (IPTW) to the observations, which are then fitted to a marginal structural model (MSM).(4,5) IPTW are used to make the exposure at time 0 and 1 independent of the confounders that occur beforehand and allow us to generate a causal interpretation between the treatment exposure on the outcome.


DESCRIPTION OF METHODS

IPTW are weights assigned to each observation across time conditioned on the previous exposure history, which are then multiplied to generate a single weight for a subject. Similar to conventional propensity score estimation, IPTW is generated using either a logit or probit model that regresses covariates to a treatment group (exposure) variable. With IPTW, the previous exposure history is incorporated to the propensity score estimation, which is time-varying.

Standardized weights in a longitudinal setting are estimated as

 
Figure 2 - sw equation.png
 

where A is the exposure for subject i at time t_ij (time points range starting at k = 0 to k=j). The numerator contains the probability of the observed exposure at each time point (a_ik) conditioned on the observed exposure history of the previous time point (a_ik-1) and the observed non-time varying covariates (v_i). The denominator contains the probability of the observed exposure at each time point conditioned on the observed exposure history of the previous time point (a_ik-1), the observed time-varying covariates history at the current time point (c_ik), and the non-time varying covariates (v_i).

In standardized weights, the time-varying confounders are captured in the denominator but not in the numerator. However, the non-time varying (also known as fixed-time) covariates are captured in both the numerator and denominator to stabilize the weights. Using stabilized weights is preferable to non-standardized weights, which are not discussed in this article.

Some statistical software are unable to handle time-varying weights; hence, a single weight for each individual needs to be estimated. Once the standardized weights for subject i at time t_ij are calculated, a single weight is estimated by multiplying all the standardized weights across the time points, which is then applied in a marginal structural model for subject i.

There are several key assumptions that must be made in order for IPTW methods to generate causal interpretation between the exposure and outcome (Thoemmes and colleagues provides a detailed explanation in their paper)(5):

1) No unmeasured confounding

2) Positivity

3) Correct specification of the IPTW


Given these assumptions are met, using IPTW fitted to an MSM can yield causal inference between the treatment exposure and outcome. This method is flexible enough where it can be applied to a linear mixed effects model, generalized estimating equation model, and survival model. Gerhard and colleagues used this approach (marginal structural Cox model) to estimate the treatment effects of antihypertensive therapy in a non-randomized trial.(6) Hernan and colleagues used a marginal structural Cox proportional hazard model to estimate the treatment effect of zidovudine and Pnuemocystis carinii therapy on survival of HIV-positive homosexual males in a non-randomized trial.(4)  


MOTIVATING EXAMPLE

This article will use CRAN R program statistical software to perform the IPTW fitted to an MSM. We will use the data that was simulated using the following R commands.

#set seed to replicate results
set.seed(12345)

#define sample size
n <- 2000

#define confounder c1 (gender, male==1)
male <- rbinom(n,1,0.55)

#define confounder c2 (age)
age <- exp(rnorm(n, 3, 0.5))

#define treatment at time 1
t_1 <- rbinom(n,1,0.20)

#define treatment at time 2
t_2 <- rbinom(n,1,0.20)

#define treatment at time 3
t_3 <- rbinom(n,1,0.20)

#define depression at time 1 (prevalence = number per 100000 population)
d_1 <- exp(rnorm(n, 0.001, 0.5))

#define depression at time 2 (prevalence = number per 100000 population)
d_2 <- exp(rnorm(n, 0.002, 0.5))

#define depression at time 3 (prevalence = number per 100000 population)
d_3 <- exp(rnorm(n, 0.004, 0.5))

#define tme-varying confounder v1 as a function of t1 and d1
v_1 <- (0.4*t_1 + 0.80*d_1 + rnorm(n, 0, sqrt(0.99))) + 5

#define tme-varying confounder v2 as a function of t1 and d1
v_2 <- (0.4*t_2 + 0.80*d_2 + rnorm(n, 0, sqrt(0.55))) + 5

#define tme-varying confounder v3 as a function of t1 and d1
v_3 <- (0.4*t_3 + 0.80*d_3 + rnorm(n, 0, sqrt(0.33))) + 5

#put all in a dataframe and write data to harddrive to use later in e.g. SPSS
df1 <- data.frame(male, age, v_1, v_2, v_3, t_1, t_2, t_3, d_1, d_2, d_3)

write.table(round(df1,11),"data1.csv", row.names = FALSE, quote = FALSE)

A little data manipulation was done to make treatment in the following period equal to 1 if the previous period was also equal to 1. In other words, E[Treatment=1, time=1 | Treatment=1, time=time-1]. Age was rounded to the nearest whole number. You can download the *CSV file here.

The dataset contains variables for id, male, age, treatment (t), outcome (d), time-varying covariate (v), and time. Exploring the dataset set, we see the structure as:

 
Figure 4 - dataset.png
 

There are 2000 individuals with three repeated measures of the t, v, and d variables. The t variable represents the Treatment exposure, which is time-varying. The v variable represents an arbitrary time-varying covariate. And the d variable is the outcome (dependent) variable, which is also time-varying. Non-time varying covariates include the age at baseline and the gender of each individual.


LONGITUDINAL DATA ANALYSIS APPROACH

Generalized estimating equations (GEE) were constructed to evaluate the impact of the treatment (t) on the outcome (d) and to handle the time-varying covariate (v) in the panel dataset. Since the outcome was a continuous variable, a generalized linear Gaussian family with identity link was used. Auto-regressive (AR1) correlation structure was selected since this was a time series (panel) data; we expected the correlation to decay as the outcome values were farther away from the time of interest. 

We will need the following packages:

geepack

survey

ipw

reshape

deplyr


The following R code was used to generate the IPTW and fitted to a MSM using GEE.

#######################################################################
# Install the required packages
#######################################################################
library(geepack)
library(survey)
library(ipw)
#library(foreign)
#library(multcomp)
#library(gee)
library(reshape)
library(dplyr)

#######################################################################
#Estimate ipw weights (time-varying)
#######################################################################
# estimate inverse probability weights (time-varying) using a logistic regression
w <- ipwtm(
  exposure = t,
  family = "binomial",
  link = "logit",
  numerator = ~ factor(male) + age,
  denominator = ~ v + factor(male) + age,
  id = id,
  timevar=time,
  type="first",
  data = data_long_sort)
summary(w$ipw.weights)

iptw = w$ipw.weights


# Add the iptw variable onto a new dataframe = data2.
data2 <- cbind(data_long_sort, iptw)

#######################################################################
# Plot the stabilized inverse probability weights
#######################################################################
ipwplot(weights = data2$iptw, 
        timevar = data2$time, 
        binwidth = 0.5,
        main = "Stabilized weights", 
        xaxt = "n",
        yaxt = "n")

#######################################################################
# confint.geeglm function (to generate 95% CI for the geeglm())
#######################################################################
confint.geeglm <- function(object, parm, level = 0.95, ...) {
  cc <- coef(summary(object))
  mult <- qnorm((1+level)/2)
  citab <- with(as.data.frame(cc),
                cbind(lwr=Estimate-mult*Std.err,
                      upr=Estimate+mult*Std.err))
  rownames(citab) <- rownames(cc)
  citab[parm,]
}


#######################################################################
# GEE model #1.1 - GEE with cluster robust SE (no IPTW)
#######################################################################
gee.bias <- geeglm(d~t + time + factor(male) + age + cluster(id),
                    id=id,
                    data=data2, 
                    family=gaussian("identity"), 
                    corstr="ar1")
summary(gee.bias)
confint.geeglm(gee.bias, level=0.95)

#######################################################################
# GEE model #2 - IPTW fitted to MSM with clustered robust SE
#######################################################################
gee.iptw <- geeglm(d~t + time + factor(male) + age + cluster(id),
                   id=id,
                   data=data2, 
                   family=gaussian("identity"), 
                   corstr="ar1", 
                   weights=iptw)
summary(gee.iptw)
confint.geeglm(gee.iptw, level=0.95)

We compared the findings from the convention GEE model without IPTW to the GEE model incorporating IPTW (Table). The differences are significant. In the standard GEE model, the treatment (t) is associated with a reduction in the outcome (d) by 0.012 units with a 95% confidence interval (CI) of -0.020 and 0.045, which is not statistically significant. Conversely, in the GEE model incorporating IPTW, the treatment (t) is associated with a reduction in the outcome (d) by 0.071 units with a 95% CI of -0.104 and -0.038, which is statistically significant. 

Figure 5 - model comparisons.png


CONCLUSIONS

Based on our findings, the IPTW fitted to a MSM (GEE model) resulted in a statistically significant reduction in the treatment on the outcome that would not have otherwise been captured in the conventional GEE model. Given that there are time-varying covariates (especially with the treatment variable), IPTW fitted to a MSM may yield important differences that would otherwise be unidentified with conventional methods. However, it is critical that all assumptions regarding the IPTW method are satisfied prior to accepting the model’s results.


REFERENCES

1. Williamson T, Ravani P. Marginal structural models in clinical research: when and how to use them? Nephrol Dial Transplant. 2017 Apr 1;32(suppl_2):ii84–90.

2. Robins JM, Hernán MA, Brumback B. Marginal structural models and causal inference in epidemiology. Epidemiol Camb Mass. 2000 Sep;11(5):550–60.

3. Hernán MA, Hernández-Díaz S, Robins JM. A structural approach to selection bias. Epidemiol Camb Mass. 2004 Sep;15(5):615–25.

4. Hernán MA, Brumback B, Robins JM. Marginal Structural Models to Estimate the Joint Causal Effect of Nonrandomized Treatments. J Am Stat Assoc. 2001 Jun 1;96(454):440–8.

5. Thoemmes F, Ong AD. A Primer on Inverse Probability of Treatment Weighting and Marginal Structural Models. Emerg Adulthood. 2016 Feb 1;4(1):40–59.

6. Gerhard T, Delaney JA, Cooper-DeHoff RM, Shuster J, Brumback BA, Johnson JA, et al. Comparing marginal structural models to standard methods for estimating treatment effects of antihypertensive combination therapy. BMC Med Res Methodol. 2012 Aug 6;12:119.

Estimating marginal effects using Stata Part 1 – Linear models

BACKGROUND

Regression models provide unique opportunities to examine the impact of certain predictors on a specific outcome. These predictors’ effects are usually isolated using the model coefficients adjusting for all other predictors or covariates. A simple linear regression model with a single predictor x_i is represented as

 
fig1.png
 

where y_i denotes the outcome (dependent) variable for subject i, beta0 denotes the intercept, beta1 is the model coefficient that denotes the change in y due to a 1-unit change in x, and epsilon_i is the error term for subject i.

A 1-unit increase in x is associated with some change in the outcome y. This finding may explain predictor variable x’s impact on outcome variable y, but it doesn’t not tell us the impact of a representative or prototypical case.

The marginal effect allows us to examine the impact of variable x on outcome y for representative or prototypical cases. For example, Stata’s margins command can tell us the marginal effect of body mass index (BMI) between a 50-year old versus a 25-year old subject.

There are three types of marginal effects of interest:

1.       Marginal effect at the means (MEM)

2.       Average marginal effect (AME)

3.       Marginal effect at representative values (MER)

Each of these marginal effects have unique interpretations that will impact how you examine the regression results. (We will focus on the first two, since the third one is an extension of the AME.) The objective of this tutorial is to review these marginal effects and understand their interpretations through examples using Stata.


MOTIVATING EXAMPLE

We will use the Second National Health and Nutrition Examination Survey (NHANES) data from the 1980s, which can be found in Stata’s library using the following command:

use http://www.stata-press.com/data/r15/nhanes2.dta

Table 1 summarizes the characteristics of the NHANES population.

fig2.png


ADJUSTED PREDICTIONS

Adjusted prediction for a regression model provides the expected value of an outcome y conditioned on x assuming all other things are equal. In other words, this is the effect of the predictor variable x regressed to outcome variable y adjusting or controlling for other covariates. Therefore, if you were comparing the effect of a 1-unit increase in age to the BMI, then you could compare this across all patients who are equally White, Black, or Others.

Example 1

A simple linear regression model can capture the incremental effect of age on body mass index. For example, the impact of age on body mass index (BMI) can be represented as a linear regression:

 
FIG3.png
 

where BMI_1  is the body mass index for individual i, beta0 denotes the intercept (or BMI when AGE=0), beta1 denotes the change in BMI for each 1-unit increase in Age for individual i, and episilon_i denotes the error term for individual i. (The unit of BMI is kg/m^2).

The Stata command to perform a simple linear regression:

regress bmi age

The corresponding regression output is:

fig4.png

In this regression output example, the predictor of interest is AGE. The _cons parameter denotes the coefficient beta0 otherwise known as the intercept; therefore, a subject with AGE = 0 has a BMI that is 23.2 kg/m^2. (Although this is unrealistic, we will ignore this for now.) The impact AGE has on the BMI is denoted by the slope parameter beta1, which is the change in BMI due to a 1-unit change in Age. In this example, the a 1-unit increase in Age is associated with a 0.05 kg/m^2 increase in BMI.

If we wanted to know the difference in BMI between a 50-year old and 25-year old, we need to estimate the adjusted prediction, which estimates the difference in the outcome based on some user-defined values for the x variables.

To estimate the adjusted predicted BMI for a 50-year old, we used the following equation:

 
fig5.png
 

which is 25.7 kg/m^2. We can do this using the following Stata command:

di _b[_cons] + 50*_b[age]
25.655896

Similarly, we can estimate the adjusted predicted BMI for a 25-year old:

 
fig6.png
 

which is 24.4 kg/m^2.

The difference between these two is:

25.655896 - 24.433991 = 1.2 kg/m^2. 

Therefore, the difference in BMI between a 50-year old and 25-year old is on average 1.2 kg/m^2. This seems like a tedious process, but let’s see how we can make this exercise simpler using Stata’s margins command.

We can use Stata’s margins command to estimate the adjusted predicted BMI for a 50-year old and 25-year old:

margins, at(age=(25 50))

Figure 2. Stata’s margins command output for adjusted prediction of BMI for a 50-year old and 25-year old.

fig7.png

Example 2

We use a linear regression with other independent variables to illustrate the complexity of having other covariates adjusted in the model.

The regression model has the structure:

 
fig8.png
 

where  is the body mass index for individual i, beta0 is the intercept (or BMI when AGE=0), beta1 is the change in BMI for each 1-unit increase in Age for individual i, beta2 denotes the change in BMI for a female relative to a male, beta3 denotes the change in BMI due to contrasts in race categories (White, Black, and Other), and  is the error term for individual i. (The unit of BMI is kg/m^2).

For this example, RACE will be included into the regression model as a dummy variable using the following Stata command:

regress bmi age i.race i.sex

The corresponding regression output is:

fig9.png

The following are interpretations of the regression output.

A 1-unit increase in age is associated with a BMI increase of 0.05 kg/m^2 adjusting for race and sex or all things being equal.

Blacks are associated with a BMI increase of 1.4 kg/m^2 adjusting for age and sex compared to Whites.

Others are associated with a BMI decrease of 1.2 kg/m^2 adjusting for age and sex compared to Whites.

Females are associated with a BMI increase of 0.03 kg/m^2 adjusting for age and race.

If we wanted to know the adjusted prediction for a 50-year old and 25-year old, we can use the margins command:

margins, at(age=(25 50)) atmeans vsquish

The output is similar to Example 1 but there are some differences.

fig10.png

The atmeans option captures the “average” sample covariates. In our example, the mean proportion of females is 0.525, males is 0.475, Whites is 0.876, Blacks is 0.105, and Others is 0.019. Therefore, the adjusted predictions for 50-year old and 25-year old’s BMI is conditioned on the “average” values of the covariates in the model. This may not make sense because an individual subject can’t be 0.525 female and 0.475 male. Fortunately, we have other ways to address this with the marginal effect.


MARGINAL EFFECT

Marginal effect with the margins command generates the change in the conditional mean of outcome y with respect to a single predictor variable x. In other words, this is the partial effect of x on the outcome y for some representative or prototypical case. Usually this is obtained by performing a first-order derivative of the regression expression:

 
fig11.png
 

where the partial effect of the expected value of y condition on x is the first order derivative of the expected value of y condition on x with respect to x.

The representative or prototypical case can be the mean, observed, or a user defined case.


MARGINAL EFFECT OF THE MEAN (MEM)

MEM is the partial effect of on the dependent variable (y) conditioned on a regressor (x) after setting all the other covariates (w) at their means. In other words, MEM is the difference in x’s effect on y when all other covariates (RACE and FEMALE) are at their mean.

Let’s revisit the linear regression model but with the dummy variables included:

 
FIG12.png
 

In the output the beta1 = 0.0493881.

Getting the partial effect with respect to Age at the means for the other covariates, we use the following command:

regress bmi age i.race i.sex
FIG13.png
margins, dydx(age) atmeans vsquish
FIG14.png

Interpretation: For a subject who is average on all characteristics, the marginal change of a 1-unit increase in age is a 0.049 increase in the BMI.

We can also look at the MEM at different ages (e.g., 25 and 50 years):

margins, dydx(age) at(age=(25 50)) atmeans vsquish

This command performs the MEM for 25- and 50-year old subjects with their covariates set at the population mean. We interpret the results as the effect of age at different values of age at the average values of the other covariates.

The MEM should be:

fig15.png

The effect of age at 25 and 50 years old is an increase of 0.05 years. Notice that the MEM for 25- and 50-year olds are the same (MEM = 0.0493881). This is because the model is a linear regression. For every incremental increase in age, the incremental increase in the BMI is 0.0493881 given the other covariates are set at the mean.

To illustrate, we can manually perform this operation using the information above. Recall that the linear regression model with the dummy variables is represented as:

 
fig16.png
 

BMI for a 25-year old subject at the mean = intercept + 25*(beta1) + (mean of Black)*(beta2) + (mean of Other)*(beta3) + (mean of Female)*(beta4) = 24.42243 kg/m^2.

BMI for a 25-year old subject at the mean = 23.0528 + 25*(0.0493881) + .1049174*(1.382849) + .0193218*(-1.2243) + .5251667*(.025702) = 24.42243 kg/m^2, which is the same as the value presented in the adjusted prediction output.

Why are these the same? The linear regression is predictable in terms of the slope coefficients. Therefore, an incremental increase in predictor variable x will have the same incremental marginal increase in outcome variable y. When you apply the MEM to non-linear models, the slopes are no longer linear and will change based on varying levels of the continuous predictor x.


AVERAGE MARGINAL EFFECT (AME)

Unlike the MEM the average marginal effect (AME) doesn’t use the mean for the covariates when estimating the partial effect of the predictor variable x on the outcome variable y. Rather, the AME estimates the partial effect of the variable x on the outcome variable y for using the observed values for the covariates and then the average of that partial effect is estimated. In other words, the partial derivative is estimated with respect to x using the observed values for the other covariates (RACE and FEMALE), and then the average of that first-order derivative are averaged over the entire population to yield the AME. This is represented as:

 
ame figure.png
 

where the partial derivative of the estimated value of the outcome variable y with respect to x is conditioned on the values of covariates (w) for subject i over the entire population (N) and multiplied by beta_k (or the parameters of interest) .

Getting the partial effect with respect to Age at the observed values for the other covariates, we use the following command:

regress bmi age i.race i.sex

margins, dydx(age) asobserved vsquish
fig18.png

Interpretation: The average marginal effect of a 1-unit increase in age is a 0.049 increase in the BMI.

We can also look at the AME at different ages (e.g., 25 and 50 years):

margins, dydx(age) at(age=(25 50)) asobserved vsquish

This command performs the MEM for 25- and 50-year old subjects with their covariates set at the observed values. We interpret the results as the effect of age at different values of age at the observed values of the other covariates.

The AME should be:

fig19.png

The effect of age at 25 and 50 years old is an increase of 0.05 years. Notice that the AME for 25- and 50-year olds are the same (MEM = 0.0493881). Similar to the MEM, this is because the model is a linear regression. For every incremental increase in age, the incremental increase in the BMI is 0.0493881 given the other covariates are set at the observed values.


CONCLUSIONS

We see that the MEM and AME are exactly the same because of the linear model. The marginal effect of an increase in 1-unit of age is an increase in 0.05 kg/m^2 of the BMI. In the next part, non-linear models will be used to demonstrate that the MEM and AME are not equal.


REFERENCES

I used the following websites to help create this tutorial:

https://thomasleeper.com/margins/articles/Introduction.html

https://support.sas.com/rnd/app/ets/examples/margeff/index.html

https://www.ssc.wisc.edu/sscc/pubs/stata_margins.htm


I also used the following paper by Richard Williams:

Using the margins command to estimate and interpret adjusted predictions and marginal effects. The Stata Journal. 2012;12(2):308-331.

https://www.stata-journal.com/article.html?article=st0260

Generating Survival Curves from Study Data: An Application for Markov Models (Part 2 of 2)

BACKGROUND

In a previous blog, we provided instructions on how to generate the Weibull curve parameters (λ and γ) from an existing Kaplan-Meier curve. The Weibull parameters will allow you to generate survival curves for cost-effectiveness analysis. In the second part of this tutorial, we will take you through the process of incorporating these Weibull parameters to simulate survival using a simple three-state Markov model. Finally, we’ll show how to extrapolate the survival curve to go beyond the time frame of the Kaplan-Meier curve so that you can perform cost-effectiveness analysis across a lifetime horizon.

In this tutorial, I will:

  • Describe how to incorporate the Weibull parameters into a Markov model

  • Compare the survival probability of the Markov model to the reference Kaplan-Meier curve to validate the method and catch any errors

  • Extrapolate the survival curve across a lifetime horizon

Link to the Markov model used in this tutorial can be found here.


MOTIVATING EXAMPLE

We will use a three-state Markov model to illustrate how to incorporate the Weibull parameters and generate a survival curve (Figure 1).

Figure 1. Markov model.

 
Figure 1a.png
 

To simulate a Markov model using 40-time units (e.g., months), you will need to think about the different transition probabilities. Figure 2 lists the different transition probabilities and their calculations. We made the assumption that the transition from the Healthy state to the Sick state was 20% across all time points.


Figure 2. Transition probabilities for all health states and associated calculations.

 
Figure 2a.png
 

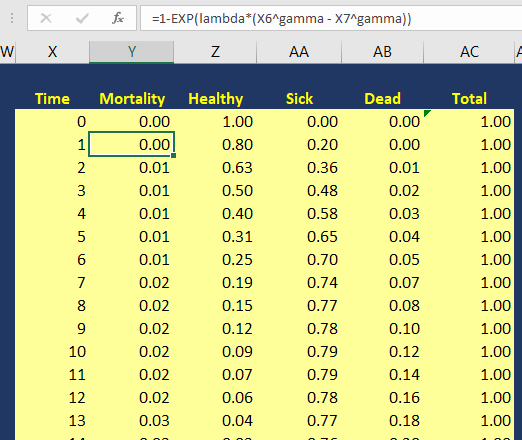
The variable pDeath(t) denotes the probability of mortality as a function of time. Since we have the lambda (λ=0.002433593) and gamma (γ=1.722273465) Weibull parameters, we can generate the Weibull curve using Excel. Figure 3 illustrates how I set up the Markov model in Excel. I used the following equation to estimate the pDeath(t):

 
equation 2.png
 

where t_i  is some time point at i. This expression can be written in Excel as (assuming T=1 and T+1 = 2):

= 1 – EXP(lambda*(T^gamma – (T+1)^gamma))

Figure 3. Calculating the probability of mortality as a function of time in Excel.

Figure 3a.png

You can estimate the probability of survival as a function of time S(t) by subtracting pDeath(t) from 1. Once you have these values, you can compare how well your Markov model was able to simulate the survival compared to the observed Kaplan-Meier curve (Figure 4).


Figure 4. Survival curve comparison between the Markov model and Kaplan-Meier curve.

Once we are comfortable with the simulated survival curve, we can extrapolate the survival probability beyond the limits of the Kaplan-Meier curve. To do this, we will need to go beyond the reference Kaplan-Meier’s time period of 40 months. In Figure 5, I extended the time cycle (denoted as Time) from 40 to 100 (truncated at 59 months).


Figure 5 illustrates the Weibull distribution extrapolated out to an entire cohort’s life time in the Markov model (Figure 5 is truncated at 59 months to fit this into the tutorial).

Figure 5a.png

Figure 6 provides an illustration of the lifetime survival of the cohort after extrapolating the time period from 40 months to 100 months. The survival curve does a relative good job of modeling the Kaplan-Meier curve. As the time period extends beyond 40 months, the Weibull curve will exponentially reach a point where all subjects will enter the Death state. This is reflected in the flat part of the Weibull curve at the late part of the time period.

Figure 6. Lifetime survival of the cohort using the Weibull extrapolation.


SUMMARY

After extrapolating the survival curve beyond the reference Kaplan-Meier curve limit of 40 months, you can estimate the lifetime horizon for a cohort of patients using a Markov model. This method is very useful when simulating chronic diseases. However, it is always good practice to calibrate your survival curves with the most recent data on the population of interest.

The U.S. National Center for Health Statistics has life tables that you can use to estimate the life expectancy of the general population, which you can compare to your simulated cohort. Moreover, if you want to compare your simulated cohort’s survival performance to a reference specific to your chronic disease cohort, you can search the literature for previously published registry data or epidemiology studies. Using existing studies as a reference will allow you to make adjustments to your survival curves that will give them credibility and validation to your cost-effectiveness analysis.


CONCLUSIONS

Using the Kaplan-Meier curves from published sources can help you to generate your own time-varying survival curves for use in a Markov model. Using the Hoyle and Henley’s Excel template to generate the survival probabilities, which are then used in an R script to generate the lambda and gamma parameters, provides a powerful tool to integrate Weibull parameters into a Markov model. Moreover, we can take advantage of the Weibull distribution to extrapolate the survival probability over the cohort’s lifetime giving us the ability to model lifetime horizons.

The Excel template developed by Hoyle and Henley generates other parameters that can be used in probabilistic sensitivity analysis like the Cholesky decomposition matrix, which will be discuss in a later blog.


REFERENCES

Location of Excel spreadsheet developed by Hoyle and Henley (Update 02/17/2019: I learned that Martin Hoyle is not hosting this on his Exeter site due to a recent change in his academic appointment. For those interested in getting access to the Excel spreadsheet used in this blog, please download it at this link).

Location of the Markov model used in this exercise is available in the following link:

https://www.dropbox.com/sh/ztbifx3841xzfw9/AAAby7qYLjGn8ZfbduJmAsVva?dl=0

Symmetry Solutions. “Engauge Digitizer—Convert Images into Useable Data.” Available at the following url: https://www.youtube.com/watch?v=EZTlyXZcRxI

Engauge Digitizer: Mark Mitchell, Baurzhan Muftakhidinov and Tobias Winchen et al, "Engauge Digitizer Software." Webpage: http://markummitchell.github.io/engauge-digitizer [Last Accessed: February 3, 2018].

  1. Hoyle MW, Henley W. Improved curve fits to summary survival data: application to economic evaluation of health technologies. BMC Med Res Methodol 2011;11:139.


ACKNOWLEDGMENTS

I want to thank Solomon J. Lubinga for helping me with my first attempt to use Weibull curves in a cost-effectiveness analysis. His deep understanding and patient tutelage are characteristics that I aspire to. I also want to thank Elizabeth D. Brouwer for her comments and edits, which have improved the readability and flow of this blog. Additionally, I want to thank my doctoral dissertation chair, Beth Devine, for her edits and mentorship.


Generating Survival Curves from Study Data: An Application for Markov Models (Part 1 of 2)

BACKGROUND

In cost-effectiveness analysis (CEA), a life-time horizon is commonly used to simulate a chronic disease. Data for mortality are normally derived from survival curves or Kaplan-Meier curves published in clinical trials. However, these Kaplan-Meier curves may only provide survival data up to a few months to a few years. Extrapolation to a lifetime horizon is possible using a series of methods based on parametric survival models (e.g., Weibull, exponential); but performing these projections can be challenging without the appropriate data and software.

This blog provides a practical, step-by-step tutorial to estimate a parameter method (Weibull) from a survival function for use in CEA models. Specifically, I will describe how to:

  • Capture the coordinates of a published Kaplan-Meier curve and export the results into a *.CSV file

  • Estimate the survival function based on the coordinates from the previous step using a pre-built template

  • Generate a Weibull curve that closely resembles the survival function and whose parameters can be easily incorporated into a simple three-state Markov model


MOTIVATING EXAMPLE

We will use an example dataset from Stata’s data library. (You can use any published Kaplan-Meier curve. I use Stata's data library for convenience.) Open Stata and enter the following in the command line:

use http://www.stata-press.com/data/r15/drug2b
sts graph, by(drug) risktable

You should get a Kaplan-Meier curve that illustrates the survival probability of two different drugs (Figure 1). The Y-axis denotes the survival probability and the X-axis denotes the time in months. Below the figure is the number at risk for the two drug comparators. We will need this to generate our Weibull curves. (If possible, find a Kaplan-Meier curve with the number at risk. It will make the Weibull curve generation easier.) Alternative methods exist to use Kaplan-Meier curves without the number at risk, but they will not be discussed in this tutorial.

Figure 1. Kaplan-Meier curve.

Figure 1.png

You will need to download the “Engauge Digitizer” application to convert this Kaplan-Meier curve into a *.CSV file with the appropriate data points. This will help you to develop an accurate survival curve based on the Kaplan-Meier curve. You can download the “Engauge Digitizer” application here: https://markummitchell.github.io/engauge-digitizer/

After you download “Engauge Digitizer,” open it and import the Kaplan-Meier file. Your interface should look like the following:

Figure 2. Engauge Digitizer interface.

Figure 2.png

The right panel guides you in digitizing your Kaplan-Meier figure. Follow this guide carefully. I will not go into how to use “Engauge Digitizer;” however a YouTube video tutorial to use Engauge Digitizer was developed by Symmetry Solutions and is available here.

We will use the top Kaplan-Meier curve (which is highlighted with blue crosshairs in Figure 3) to generate our Weibull curves.

Figure 3. Select the top curve to digitize.

Figure 3.png

After you digitize the figure, you will export the data as a *.CSV file. The *.CSV file should have two columns corresponding to the X- and Y-axes of the Kaplan-Meier figure. Figure 4 has the X values end at row 20 to fit onto the page, but this extends till the end of the Kaplan-Meier time period, which is 40.

Figure 4. *.CSV file generated from the Kaplan-Meier curve (truncated to fit onto this page).

Figure 4.png

I usually superimpose the “Engauge Digitizer” results with the actual Kaplan-Meier figure to prove to myself (and others) that the curves are exactly the same (Figure 5). This is a good practice to convince yourself that your digitized data properly reflects the Kaplan-Meier curve from the study.

Figure 5. Kaplan-Meier curve superimposed on top of the Engauge Digitizer curve.

Figure 5.png

Now, that we have the digitized version of the Kaplan-Meier, we need to format the data to import into the Weibull curve generator. Hoyle and Henley wrote a paper that explains their methods for using the results from the digitizer to generate Weibull curves.[1] We will use the Excel template they developed in order to generate the relevant Weibull curve parameters. (The link to the Excel template is provided at the end of this tutorial.)

I always format the data to match the Excel template developed by Hoyle and Henley. The blue box indicates the number at risk at the time points denoted by Figure 1 and the red box highlights the evenly spaced time intervals that I estimated (Figure 6).

Figure 6. Setting up your data using the template from Hoyle and Henley.

Figure 6.png

In order to find the survival probability at each “Start time” listed in the Excel template by Hoyle and Henley, linear interpolation is used. [You can use other methods to estimate the survival probability between each time points given the data on Figure 3 (e.g., last observation carried forward); however, I prefer to use linear interpolation.] In Figure 7, the survival probabilities (Y) correspond to a time (X) that was generated by the digitizer. Now, we want to find the Y value corresponding to the X values on the Excel template.

Figure 7. Generating the Y-values using linear interpolation.

Figure 7.png

Figure 8 illustrates how we apply the linear interpolation to estimate the Y value that corresponds with the X values from the Excel template developed by Hoyle and Henley. For example, if you were interested in finding the Y value at X = 10, the you would need to input the following into the linear interpolation equation using the following expression:

equation 1a.png

This yields a Y value of 0.866993, which is approximately 0.87.

Figure 8. Y values are generated using linear interpolation.

Figure 8.png

After generating the Y values corresponding to the Start time from Figure 5, you can enter them into the Excel template by Hoyle and Henley (Figure 9). Figure 9 illustrates the inputted survival probabilities into the Excel template.

Figure 9. Survival probabilities are entered after estimating them from linear interpolation.

Figure 9.png

After the “Empirical survival probability S(t)” is populated, you will need to go to the “R Data” worksheet in the Excel template and save this data as a *.CSV file. In this example, I saved the data as “example_data.csv” (Figure 10).

Figure 10. Data is saved as “example_data.csv.”

Figure 10.png

Then I used the following R code to estimate the Weibull parameters. This R code is located in the “Curve fitting ‘R’ code” in the Excel templated developed by Hoyle and Henley. (I modified the R code written by Hoyle and Henley to allow for a *.CSV file import.)

rm(list=ls(all=TRUE))   
library(survival)   

#    Step 4.   Update directory name and text file name in line below   
setwd("insert the folder path where the data is stored")
data<- read.csv("example_data.csv")
attach(data)
data    

times_start <-c(  rep(start_time_censor, n_censors), rep(start_time_event, n_events) )  
times_end <-c(  rep(end_time_censor, n_censors), rep(end_time_event, n_events)  )   

#  adding times for patients at risk at last time point 
######code does not apply because 0 at risk at last time point  

#   Step 5. choose one of these function forms   (WEIBULL was chosen for the example)
model <- survreg(Surv(times_start, times_end, type="interval2")~1, dist="exponential")   # Exponential function, interval censoring 
model <- survreg(Surv(times_start, times_end, type="interval2")~1, dist="weibull")   # Weibull function, interval censoring 
model <- survreg(Surv(times_start, times_end, type="interval2")~1, dist="logistic")   # Logistic function, interval censoring   
model <- survreg(Surv(times_start, times_end, type="interval2")~1, dist="lognormal")   # Lognormal function, interval censoring 
model <- survreg(Surv(times_start, times_end, type="interval2")~1, dist="loglogistic")   # Loglogistic function, interval censoring 

#   Compare AIC values  
n_patients <- sum(n_events) +  sum(n_censors)   
-2*summary(model)$loglik[1] + 1*2   #  AIC for exponential distribution 
-2*summary(model)$loglik[1] + 1*log(n_patients)   #  BIC exponential    
-2*summary(model)$loglik[1] + 2*2   #  AIC for 2-parameter distributions    
-2*summary(model)$loglik[1] + 2*log(n_patients)   #  BIC for 2-parameter distributions  


intercept <- summary(model)$table[1]   # intercept parameter    
log_scale <- summary(model)$table[2]   # log scale parameter    

#  output for the example of the Weibull distribution   
lambda <- 1/ (exp(intercept))^ (1/exp(log_scale))    # l for Weibull, where S(t) = exp(-lt^g)   
gamma <- 1/exp(log_scale)     # g for Weibull, where S(t) = exp(-lt^g)  
(1/lambda)^(1/gamma) * gamma(1+1/gamma)    # mean time for Weibull distrubtion  


#  For the Probabilistic Sensitivity Analysis, we need the Cholesky matrix, which captures the variance and covariance of parameters    
t(chol(summary(model)$var))    #  Cholesky matrix   

#  Simulate variability of mean for Weibull 
library(MASS)   

simulations <- 10000  # number of simulations for standard deviation of mean    
sim_parameters <- mvrnorm(n=simulations, summary(model)$table[,1],  summary(model)$var  )   # simulates simulations from multivariate normal    
intercepts <- sim_parameters[,1]   # intercept parameters   
log_scales <- sim_parameters[,2]   # log scale parameters   
lambdas <- 1/ (exp(intercepts))^ (1/exp(log_scales))    # l for Weibull, where S(t) = exp(-lt^g)    
gammas <- 1/exp(log_scales)     # g for Weibull, where S(t) = exp(-lt^g)    
means <- (1/lambdas)^(1/gammas) * gamma(1+1/gammas)    # mean times for Weibull distrubtion 
sd(means)   # standard deviation of mean survival   

# consider adding this (from Arman Oct 2016) to plot KM 
km <- survfit(Surv(times_start, times_end, type="interval2")~ 1)    
summary(km) 
plot(km, xmax=600, xlab="Time (Days)", ylab="Survival Probability") 

There are several elements generated by the above R code that you need to record, including the intercept and log-scale:  

> intercept
[1] 3.494443
> log_scale
[1] -0.5436452

Once you have this, input them into the Excel template sheet titled “Number events & censored,” which is the same sheet you used to generate the survival probabilities after entering the data from the “Engauge Digitizer.” Figure 11 illustrates where these parameters are entered (red square).

Figure 11. Enter the intercept and log scale parameters into the Excel template developed by Hoyle and Henley.

Figure 11.png

You can check the fit of the Weibull curve to the observed Kaplan-Meier curve in the tab “Kaplan-Meier.” Figure 12 illustrates the Weibull fit’s approximation of the observed Kaplan-Meier curve.

Figure 12. Weibull fit (red curve) of the observed Kaplan-Meier curve (blue line).

Figure 12.png

From Figure 11, we also have the lambda (λ=0.002433593) and gamma (γ=1.722273465) parameters which we’ll use to simulate survival using a Markov model.


SUMMARY

In the next blog, we will discuss how to use the Weibull parameters to generate a survival curve using a Markov model. Additionally, we will learn how to extrapolate the survival curve beyond the time period used to generate the Weibull parameters for cost-effectiveness studies that use a lifetime horizon.


REFERENCES

Location of Excel spreadsheet developed by Hoyle and Henley (Update 02/17/2019: I learned that Martin Hoyle is not hosting this on his Exeter site due to a recent change in his academic appointment. For those interested in getting access to the Excel spreadsheet used in this blog, please download it at this link).

Update: 12 January 2023 - The old link to the YouTube video on Engauge was broken. A new link was identified that provided the same content on how to use Engauge.

Location of the Markov model used in this exercise is available in the following link:

https://www.dropbox.com/sh/ztbifx3841xzfw9/AAAby7qYLjGn8ZfbduJmAsVva?dl=0

Design with Greg. “Engauge: A Free Tool for Engineering that pairs great with Excel.” Available at the following url: https://www.youtube.com/watch?v=i1bEFovvvbM

Engauge Digitizer: Mark Mitchell, Baurzhan Muftakhidinov and Tobias Winchen et al, "Engauge Digitizer Software." Webpage: http://markummitchell.github.io/engauge-digitizer [Last Accessed: February 3, 2018].

  1. Hoyle MW, Henley W. Improved curve fits to summary survival data: application to economic evaluation of health technologies. BMC Med Res Methodol 2011;11:139.


ACKNOWLEDGMENTS

I want to thank Solomon J. Lubinga for helping me with my first attempt to use Weibull curves in a cost-effectiveness analysis. His deep understanding and patient tutelage are characteristics that I aspire to. I also want to thank Elizabeth D. Brouwer for her comments and edits, which have improved the readability and flow of this blog. Additionally, I want to thank my doctoral dissertation chair, Beth Devine, for her edits and mentorship.

Empirical Bayes estimates

Recently, my classmate asked me how to perform empirical Bayesian shrinkage, a form of estimation that tries to adjust your sample mean to the grand mean by incorporating more variables. I haven't done this as part of my regular work so I had to review my past class notes.

I forgot how useful empirical Bayes estimates were and wanted to document what I discovered. In my research, I discovered an informative guide by David Robinson who used baseball statistics as a motivating example to explain empirical Bayesian shrinkage on his blog.

In addition, Nicolas Lartillot wrote a great summary of empirical Bayes estimation and Stein's paradox on his blog.